2021 UK local government election
2021 Cambridgeshire County Council election Turnout 39.1% ([ 1] First party Second party Third party Con
Lab
Leader Steve Count Lucy Nethsingha Elisa Meschini Party Conservative Liberal Democrats Labour Leader since 25 April 2014 May 2015 December 2019 Leader's seat March North & Waldersey Newnham King's Hedges Last election 36 seats, 40.4% 15 seats, 29.9% 7 seats, 18.0% Seats before 34 16 6 Seats won 28 20 9 Seat change Popular vote 75,023 53,340 36,437 Percentage 39.5% 28.1% 19.2% Swing Fourth party Fifth party Sixth party Party Independent St Neots Independents Green Last election 1 seats, 2.7% 2 seats, 1.8% 0 seats, 3.7% Seats before 2 2 0 Seats won 2 2 0 Seat change Popular vote 5,150 2,283 17,445 Percentage 2.7% 1.2% 9.3% Swing
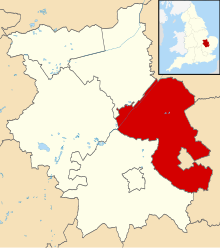
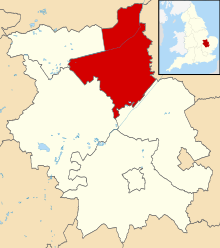
Map showing the results of the 2021 Cambridgeshire County Council election
Council composition after the election
Council control before election Conservative
Council control after election No Overall Control
The 2021 Cambridgeshire County Council election took place on 6 May 2021 as part of the 2021 local elections in the United Kingdom.[ 2] electoral divisions , which returned either one or two county councillors each by first-past-the-post voting for a four-year term of office. The election was held alongside a full election for Cambridge City Council, the Cambridgeshire Police and Crime Commissioner , Mayor of Cambridgeshire and Peterborough and one-third of Peterborough City Council.[ 3] [ 4] [ 5]
Previous composition
2017 election Party Seats Conservative 36 Liberal Democrats 15 Labour 7 St Neots Independents 2 Independent 1 Total 61
Composition of council seats before election Party Seats Conservative 34 Liberal Democrats 16 Labour 6 St Neots Independents 2 Independent 2 Vacant (Conservative) [ 6] 1 Total 61
[ 7]
Changes between elections In between the 2017 election and the 2021 election, the following council seats changed hands:
Division Date Previous Party New Party Cause Resulting Council Composition Con LDem Lab STI Ind Trumpington May 2018[ 8] Liberal Democrats Independent Sitting councillor loses Whip. 36 14 7 2 2 Trumpington 2 May 2019[ 9] Independent Liberal Democrats Independent incumbent resigned. Liberal Democrats won by-election. 36 15 7 2 1 Duxford 27 February 2020[ 10] Conservative Liberal Democrats Conservative incumbent resigned. Liberal Democrats won by-election. 35 16 7 2 1 Cherry Hinton 7 December 2020[ 11] Labour Independent Councillor quit party to sit as an independent member. 35 16 6 2 2 Sawston and Shelford 26 February 2021[ 12] Conservative Vacant Sitting councillor resigned.[ 13] 34 16 6 2 2
The campaign The Hickford Inquiry (that had come to be known in the press as 'Farmgate') into the tenancy of a county council owned farm by sitting Conservative councillor Roger Hickford and the delay in releasing the report was widely discussed in social media and covered in the local press election campaign coverage. Allegations of bullying and insider trading were made against the Conservative deputy-leader.[ 14] Fenland District Council and the prime minister's flat refurbishment, there was a risk of allegations of sleaze dominating the campaign.[ 15] [ 16]
Results summary Results Map Party Councillors Votes Of total Net Of total Net Conservative Party 28 -8 77,068 39.0% -1.6% Liberal Democrats 20 +5 56,465 28.6% -1.2% Labour Party 9 +2 37,783 19.1% +0.8% Green 0 0 18,572 9.4% +5.6% Independents 2 +1 5,150 2.6% +0.3% St. Neots Independents 2 0 2,283 1.2% -0.6% UK Independence Party 0 0 343 0.2% -3.5% Trade Unionist and Socialist Coalition 0 0 55 0.0% - Workers Party of Britain 0 0 48 0.0% -
In the local government elections the Conservatives had a net gain of 13 councils in England, Cambridgeshire, however was of the few Conservative held councils that was lost.[ 17] Fenland and five divisions in Huntingdon District. The Trade Unionist and Socialist Coalition stood two candidates in the Godmanchester & Huntingdon South and the Huntingdon North & Hartford divisions. The four UK Independence Party candidates failed to win any seats. The Conservatives lost their overall majority despite winning all 9 Fenland District seats, and the low turnout in the north of the county, Wisbech West not even reaching 25%.[ 18]
Aftermath On 7 May Conservative county councillor Josh Schumann told the Cambridge Independent: "It is an indication we are going to have to work with others to ensure that the council delivers a lot of what it has done over the last four years."[ 19] BBC reported that the leaders of the Liberal Democrats, Labour and Independent groups had signed an agreement for control of the council.[ 20]
Election of group leaders Steve Count (March North & Waldersey) was reelected leader of the Conservative Group with Joshua Schumann (Burwell) as the deputy leader, Lucy Nethsingha (Newnham ) was reelected leader of the Liberal Democrat Group with Lorna Dupré (Sutton) as the deputy, and Elisa Meschini (King's Hedges ) was reelected leader of the Labour Group with Richard Howitt (Petersfield) becoming deputy leader.[ 21]
Election of leader of the council Lucy Nethsingha , the leader of the Liberal Democrat group, was duly elected leader of the council and formed a coalition administration, with Labour leader Elisa Meschini as her deputy leader.[ 22]
Results by district All electoral divisions elected one councillor unless stated otherwise.
(* denotes sitting councillor)
Cambridge District summary
Labour proved the dominant force in Cambridge, gaining seats in Chesterton and Market divisions from the Liberal Democrats, as well regaining the Cherry Hinton seat previously held by a former Labour member, who did not stand for re-election.[ 16]
Party Seats +/− Votes % +/− Labour 9 16,325 41.9 +4.8 Liberal Democrats 3 10,705 27.5 −9.7 Green 0 6,418 16.5 +8.3 Conservative 0 5,501 14.1 −0.7 UKIP 0 27 0.1 −0.6
Division results
Abbey[ 23] Party Candidate Votes % ±% Labour Alex Bulat 1,129 41.77 Green Jeremy Caddick 924 34.18 Conservative Timothy Haire 326 12.06 Liberal Democrats Rosy Ansell 324 11.99 Majority 205 7.58 Turnout 2,703 38.69 +0.0 Labour hold Swing −12.3
Arbury Party Candidate Votes % ±% Labour Hilary Cox 1,359 48.16 Liberal Democrats Fionna Tod 611 21.65 Conservative Robert Boorman 475 16.83 Green Stephen Lawrence 377 13.4 +7.4 Majority 748 26.51 +12.6 Turnout 2,822 40.87 −2.6 Labour hold Swing +6.3
Castle Party Candidate Votes % ±% Labour Catherine Rae 1,339 40.65 Liberal Democrats Alastair Gadney 1,105 33.55 Green Simon Baron 537 16.30 Conservative Philip Salway 313 9.50 Majority 234 7.03 +6.1 Turnout 3,329 49.15 +2.9 Labour hold Swing +2.8
Cherry Hinton Party Candidate Votes % ±% Labour Bryony Goodliffe 1,617 48.59 Conservative Eric Barrett-Payton 861 25.87 Green Richard Potter 456 13.70 Liberal Democrats Gillian Moore 394 11.84 Majority 756 22.72 Turnout 3,328 40.17 +1.2 Labour hold Swing −1.8
Chesterton Party Candidate Votes % ±% Labour Gerri Bird 1,639 39.91 Liberal Democrats Ian Manning * 1,505 36.64 Green Elizabeth May 520 12.66 Conservative Mike Harford 416 10.13 UKIP Peter Burkinshaw 27 0.66 Majority 134 3.26 Turnout 4,107 51.32 +2.7 Labour gain from Liberal Democrats Swing +5.6
King's Hedges Party Candidate Votes % ±% Labour Elisa Meschini * 1,478 49.25 Liberal Democrats Richard Rathwell 570 18.99 Conservative John Ionides 503 16.76 Green Mark Slade 450 15.00 Majority 908 30.26 +24.1 Turnout 3,001 34.94 −1.1 Labour hold Swing +12.1
Market Party Candidate Votes % ±% Labour Nick Gay 872 37.63 Liberal Democrats Yemi Macaulay 781 33.71 Green Nicola Elliott 432 18.64 Conservative Phoebe Pickering 232 10.01 −0.3 Majority 91 3.93 −8.5 Turnout 2,317 34.11 +0.6 Labour gain from Liberal Democrats Swing
Newnham Party Candidate Votes % ±% Liberal Democrats Lucy Nethsingha * 971 41.66 Labour Tariq Sadiq 777 33.33 Green Shanna Hart 386 16.56 Conservative James Vitali 197 8.45 −3.9 Majority 194 8.32 −14.6 Turnout 2,331 40.57 +0.3 Liberal Democrats hold Swing
Petersfield Party Candidate Votes % ±% Labour Richard Howitt 1,896 48.47 Liberal Democrats Mark Argent 1,018 26.02 Green Edwin Wilkinson 606 15.49 Conservative Shapour Meftah 392 10.02 −1.3 Majority 878 22.4 +15.2 Turnout 3,912 46.29 +3.6 Labour hold Swing
Queen Ediths Party Candidate Votes % ±% Liberal Democrats Alex Beckett 1,355 35.95 Labour Steve King 1,168 30.99 Conservative Donald Douglas 647 17.17 Green Jacqueline Whitmore 599 15.89 Majority 187 4.96 −14.8 Turnout 3,769 48.91 +0.1 Liberal Democrats hold Swing −7.4
Romsey Party Candidate Votes % ±% Labour Neil Shailer 2,056 53.17 Green Elisabeth Whitebread 722 18.67 Liberal Democrats Sam Oliver 601 15.54 Conservative Daniel Collis 488 12.62 +3.5 Majority 1,334 34.5 +27.0 Turnout 3,867 42.94 −0.6 Labour hold Swing
Trumpington Party Candidate Votes % ±% Liberal Democrats Philippa Slatter 1,470 41.70 Labour Pam Stacey 995 28.23 Conservative Steven George 651 18.47 Green Ceri Galloway 409 11.60 +4.5 Majority 475 13.48 +4.1 Turnout 3,525 41.38 −3.0 Liberal Democrats hold Swing
[ 24]
East Cambridgeshire District summary
The Liberal Democrats gained both Ely seats from the Conservatives, and held on to their Sutton seat. Elsewhere, East Cambs remained blue.[ 16]
Party Seats +/− Votes % +/− Conservative 5 10,480 44.2 −10.0 Liberal Democrats 3 8,113 34.2 +3.4 Labour 0 3,614 15.2 +2.6 Green 0 1,514 6.4 +4.0
Division results
Burwell Party Candidate Votes % ±% Conservative Josh Schumann * 1,551 51.60 Liberal Democrats Charlotte Kathryn Bourne Cane 761 25.32 Labour Liz Swift 694 23.09 Majority 789 26.25 Turnout 3,006 33.84 Conservative hold Swing
Ely North Party Candidate Votes % ±% Liberal Democrats Alison Whelan 1,233 42.14 Conservative Richard Hobbs 1,080 36.91 Labour Louise Moschetta 373 12.75 Green Richard Ingram 240 8.20 N/A Majority 151 5.23 Turnout 2,926 41.58 Liberal Democrats gain from Conservative Swing
Ely South Party Candidate Votes % ±% Liberal Democrats Piers Coutts 1,763 45.64 Conservative John McFall 1,122 29.04 Labour Rebecca Denness 618 16.00 Green Gemma Bristow 360 9.32 N/A Majority 641 16.59 Turnout 3,863 46.76 Liberal Democrats gain from Conservative Swing
Littleport Party Candidate Votes % ±% Conservative David Ambrose Smith * 904 53.71 Labour Adam Cooley 363 21.57 Liberal Democrats Paul Speed 251 14.91 Green Lee Phillips 165 9.80 N/A Majority 541 32.14 Turnout 1,683 23.39 Conservative hold Swing
Soham North & Isleham Party Candidate Votes % ±% Conservative Mark Goldsack 1,570 62.93 Liberal Democrats Charles Warner 400 16.03 Labour Mark Hucker 367 14.71 Green Katy Prentice 158 6.33 N/A Majority 1,170 46.89 Turnout 2,532 29.61 Conservative hold Swing
Soham South and Haddenham Party Candidate Votes % ±% Conservative Dan Schumann 1,620 51.44 Liberal Democrats Helen Barker 740 23.50 Labour Lydia Hill 553 17.56 Green Floramay Waterhouse 236 7.49 +1.4 Majority 880 Turnout 3,149 35.39 Conservative hold Swing
Sutton Party Candidate Votes % ±% Liberal Democrats Lorna Helen Dupre * 2,155 65.26 Conservative Jonathan Rodney Farmer 972 29.44 Labour Carlos Toranzos 175 5.30 −6.0 Majority 1,183 Turnout 3,302 37.81 Liberal Democrats hold Swing
Woodditton Party Candidate Votes % ±% Conservative Alan Gordon Sharp 1,661 50.39 Liberal Democrats Charles Edward Powell 809 24.54 Labour Steven John O'Dell 471 14.29 Green Elaine Marshall 355 10.77 N/A Majority 852 Turnout 3,296 38.17 Conservative hold Swing
[ 25]
Fenland [ 26] [ 27]
District summary
It was a clean sweep for the Conservative Party in Fenland. Despite some very low turnouts and swings against some candidates, they held every seat. Among those returning was Conservative group leader Steve Count.[ 16]
Party Seats +/− Votes % +/− Conservative 9 17,030 63.0 +8.3 Labour 0 4,411 16.3 +2.7 Independent 0 2,077 7.7 +1.2 Liberal Democrats 0 1,946 7.3 -2.2 Green 0 1,299 4.8 +1.8 UKIP 0 97 0.4 −11.8 Workers Party 0 48 0.2 +0.2
Division results
Chatteris Party Candidate Votes % ±% Conservative Anne Hay* 1,410 59.12 Labour Marian Phillips 413 17.32 Independent Daniel Divine 405 16.98 +9.4 Green Andrew Crawford 157 6.6 N/A Majority 997 Turnout 2,385 28.69 −1.4 Conservative hold Swing
March North & Waldersey (2 Seats)[ 27] Party Candidate Votes % ±% Conservative Jan French* 2,978 57.7 +8.3 Conservative Steve Count* 2,906 56.3 +2.9 Labour Martin Field 1,053 20.4 +0.3 Labour Mark Taylor 667 12.9 −7.3 Liberal Democrats Sarah Bligh 640 12.4 −1.9 Green Jazmin Stewart 446 8.6 +2.7 Green Robert White 384 7.4 +2.9 Independent David Patrick 381 7.4 N/A Majority 1,853 Turnout 5,188 28.36 Conservative hold Swing Conservative hold Swing
March South & Rural[ 27] Party Candidate Votes % ±% Conservative John Gowing* 1,819 68.51 Labour Amanda Hirson 480 18.08 Liberal Democrats Liam O'Rourke 192 7.23 Green Emma Pollard 164 6.18 Majority 1,339 50.43 Turnout 2,655 31.83 Conservative hold Swing
Roman Bank & Peckover [ 27] Party Candidate Votes % ±% Conservative Simon King* 1,728 57.56 Liberal Democrats Gavin Booth 895 29.81 Labour Chris Mountain 242 8.06 Green Ruth Johnson 137 4.56 N/A Majority 833 Turnout 3,002 33.04 Conservative hold Swing
Whittlesey North[ 27] Party Candidate Votes % ±% Conservative Chris Boden* 2,055 75.39 Labour Peter Bibb 571 20.95 Liberal Democrats Diane Cutler 100 3.67 Majority 1,484 Turnout 2,726 33.68 Conservative hold Swing
Whittlesey South [ 27] Party Candidate Votes % ±% Conservative David Connor* 1,727 61.09 Labour Jes Hibbert 497 17.58 Independent Bob Wicks 455 16.1 N/A Green Simon Wilkes 148 5.2 Majority 1,232 Turnout 2,827 32.74 Conservative hold Swing
Wisbech East [ 27] Party Candidate Votes % ±% Conservative Samantha Hoy* 1,358 62.6 −0.6 Independent Spike Crowson 358 16.5 N/A Labour Reginald Martin Mee 286 13.2 −1.9 Liberal Democrats Rasa McGill 119 5.5 +2.34 Workers Party Clayton Maxwell Payne 48 2.21 N/A Majority 1,000 Turnout 2,169 27.96 Conservative hold Swing
Wisbech West [ 27] Party Candidate Votes % ±% Conservative Steve Tierney* 1,049 57.5 −3.6 Independent Andy Maul 451 24.7 N/A Labour Daniel James Kerry 202 11.1 +0.3 UKIP Ted Hurlock 97 5.3 −6.7 Independent Lynn Monk 27 1.5 N/A Majority 598 Turnout 1,826 24.18 Conservative hold Swing
Huntingdonshire District summary
The Conservative Party gained a couple of seats in Huntingdonshire from the Liberal Democrats, strengthening their hold on the area, losing by just 11 votes in St Neots East and Gransden to Stephen Ferguson (Independent).[ 16]
Division results
Alconbury & Kimbolton Party Candidate Votes % ±% Conservative Ian Derek Gardener * 2,362 68.0 +6.2 Liberal Democrats Alastair Angus Henderson-Begg 488 14.0 −16.9 Green John McCutcheon 319 9.2 N/A Labour Philip Nigel Sly 306 8.8 +1.5 Majority 1,874 Turnout 3,475 43.21 Conservative hold Swing
Brampton & Buckden Party Candidate Votes % ±% Conservative Ken Billington 1,494 43.4 −1.6 Liberal Democrats John Richard Childs 1,326 38.5 −10.1 Labour Sam Wakeford 419 12.2 +5.7 Green Gareth John Holsgrove 206 6.0 N/A Majority 168 Turnout 3,445 38.94 Conservative gain from Liberal Democrats Swing
Godmanchester & Huntingdon South Party Candidate Votes % ±% Liberal Democrats Graham Martin Wilson* 1,258 46.0 −6.3 Conservative Paula Jane Sparling 972 35.6 +6.9 Labour Samuel Paul Week 465 17.0 +4.7 TUSC Will Martin 38 1.4 N/A Majority 286 Turnout 2,733 36.89 Liberal Democrats hold Swing
Huntingdon North & Hartford Party Candidate Votes % ±% Conservative Jonas King 1,039 39.0 +5.6 Labour Patrick Kadewere 847 31.8 +10.7 Liberal Democrats Phil Pearce 670 25.1 −9.9 UKIP Peter Henry Ashcroft 93 3.5 −7.0 TUSC Geoff Eagle 17 0.6 N/A Majority 192 Turnout 2,666 31.88 Conservative gain from Liberal Democrats Swing
Huntingdon West Party Candidate Votes % ±% Independent Tom Sanderson * 1,427 55.2 +7.2 Labour Leedo George 636 24.9 +13.1 Conservative Gus Thomas Rankin 494 19.3 −6.1 Majority 791 Turnout 2,588 34.73 Independent hold Swing
Ramsey & Bury Party Candidate Votes % ±% Conservative Adela Eva Costello * 1,698 64.6 +19.5 Independent Mike Tew 518 19.7 N/A Labour Mark Trevor Hebert 412 15.7 +6.6 Majority 1,180 Turnout 2,655 32.55 Conservative hold Swing
St Ives North & Wyton Party Candidate Votes % ±% Conservative Ryan Fuller * 1,241 51.0 −3.2 Labour Angela Louise Richards 471 19.3 +2.0 Green Ann Barnes 337 13.8 N/A Liberal Democrats James Roger Catmur 207 8.5 −9.4 Independent Paul Bullen 179 7.4 N/A Majority 770 Turnout 2,435 30.64 Conservative hold Swing
St Ives South & Needingworth Party Candidate Votes % ±% Conservative Kevin Reynolds * 1,368 45.8 −13.5 Liberal Democrats Nic Wells 749 25.1 +5.7 Labour Cath Gleadow 565 18.9 −2.4 Green John Robert George Parkin 305 10.2 N/A Majority 619 Turnout 2,987 37.99 Conservative hold Swing
St Neots East & Gransden Party Candidate Votes % ±% Independent Stephen William Ferguson 764 38.8 N/A Conservative Sam Collins 755 38.3 −14.3 Green Lara Davenport-Ray 240 12.2 N/A Labour Ryan David Lee 211 10.7 −0.7 Majority 9 0.45 Turnout 1,995 39.3 Independent hold Swing
St Neots Eynesbury Party Candidate Votes % ±% St Neots Independents Simone Leigh Taylor * 879 39.2 -4.2 Conservative Nigel Philip Eaton 834 37.3 +2.8 Labour Amy Louise Duckworth 364 16.2 +6.2 Green Liz Timms 163 7.3 N/A Majority 45 Turnout 2,241 28.58 St Neots Independents hold Swing
St Neots Priory Park & Little Paxton Party Candidate Votes % ±% Conservative Keith Ivan Prentice 1,237 46.6 +3.7 Liberal Democrats Geoffrey Michael Seeff 662 25.0 +0.9 Labour Janet Elizabeth Boston 402 15.2 +4.9 Green Daniel Edward Laycock 352 13.3 N/A Majority 575 Turnout 2,653 34.01
St Neots The Eatons Party Candidate Votes % ±% St Neots Independents Derek Arthur Giles * 1,404 42.0 -4.3 Conservative Andy Jennings 1,217 36.4 +9.0 Labour Celia Ann Emery 432 12.9 +6.3 Green Catherine James Goodman 287 8.6 −4.2 Majority 187 Turnout 3,340 34.91 St Neots Independents hold Swing
Sawtry & Stilton Party Candidate Votes % ±% Conservative Simon Bywater * 2,399 72.0 +3.2 Labour Joshua Benjamin Sandeman 514 15.4 +1.7 Liberal Democrats John Paul Morris 293 8.8 +0.5 UKIP Roger John Henson 126 3.8 N/A Majority 1,885 Turnout 3,332 35.66 Conservative hold Swing
Somersham & Earith Party Candidate Votes % ±% Conservative Steve Criswell * 1,713 62.3 −5.9 Liberal Democrats Tony Hulme 399 14.5 +0.1 Labour Karen Andrée Webb 362 13.2 +2.2 Green Kirsten Kathleen McLaughlin 278 10.1 N/A Majority 1,314 Turnout 2,802 36.3 Conservative hold Swing -3.01
The Hemingfords & Fenstanton Party Candidate Votes % ±% Conservative Douglas Bernard Dew 1,737 56.3 −5.9 Liberal Democrats David John Priestman 698 22.6 −5.0 Labour Michael John Gleadow 377 12.2 +2.0 Green Seona Gunn-Kelly 275 8.9 N/A Majority 1,039 Turnout 3,140 40.1
Warboys & The Stukeleys Party Candidate Votes % ±% Conservative Steve Corney 1,393 64.6 +2.2 Liberal Democrats Helen Kewley 383 17.8 +4.2 Labour Paul Joseph Williams 380 17.6 −9.1 Majority 1,010 Turnout 2,156 32.06 Conservative hold Swing -1.02
Yaxley & Farcet Party Candidate Votes % ±% Conservative Mac McGuire * 1,296 56.9 Liberal Democrats Andrew Richard Wood 578 25.4 N/A Labour Sarah Margaret Vivian Smalley 403 17.7 Majority 718 Turnout 2,277 27.21 Conservative hold Swing -10.43
South Cambridgeshire District summary
The Liberal Democrats in South Cambridgeshire, gained seats from Conservatives in five divisions. The closest battle was in Hardwick, where Michael Atkins (Lib Dems) beat Lina Nieto (Con) by just five votes.[ 16]
Party Seats +/− Votes % +/− Liberal Democrats 13 27,990 45.7 +5.7 Conservative 2 20,808 34.0 −6.2 Green 0 6,442 10.5 +6.6 Labour 0 5,867 9.6 −4.3 Independent 0 185 0.3 −1.1
Division results
Bar Hill[ 23] Party Candidate Votes % ±% Liberal Democrats Edna Murphy 1,500 44.92 Conservative Lynda Harford * 1,345 40.28 Green Stan Rankin 494 14.79 Majority 155 4.64 Turnout 3339 47.69 Liberal Democrats gain from Conservative Swing 8.42
Cambourne Party Candidate Votes % ±% Conservative Mark Howell * 1,155 38.25 −5.1 Liberal Democrats Stephen Drew 969 32.1 +4.2 Labour Timothy Hayes 595 19.7 −2.6 Green Marcus Pitcaithly 301 10.0 +2.8 Majority 186 Turnout 3,020 34.28 ? Conservative hold Swing -4.93
Cottenham & Willingham Party Candidate Votes % ±% Liberal Democrats Neil Gough 2,045 53.2 +17.9 Conservative Timothy Wotherspoon * 1,363 35.5 +0.2 Green Colin Coe 435 11.3 +6.2 Majority 682 Turnout 3,843 45.4 Liberal Democrats gain from Conservative Swing
Duxford Party Candidate Votes % ±% Liberal Democrats Peter John McDonald * 1,990 48.3 +15.0 Conservative Luigi Robert Murton 1,692 41.1 −14.0 Green Claire Ann James 438 10.6 +6.6 Majority 298 Turnout 4,120 49.51 Liberal Democrats gain from Conservative Swing 15
Fulbourn Party Candidate Votes % ±% Liberal Democrats Claire Hilda Gabriel Daunton 1,182 38.8 −4.6 Conservative George Searle Walker 754 24.8 −7.3 Labour Tim Andrews 666 21.9 +2.4 Green Oliver Fisher 258 8.5 +3.5 Independent Neil John Scarr 185 6.1 N/A Majority 428 Turnout 3,045 42.8 Liberal Democrats hold Swing
Gamlingay Party Candidate Votes % ±% Liberal Democrats Sebastian Gerald Molesworth Kindersley* 1,942 49.7 +7.5 Conservative Harriet Gould 1,711 43.8 +3.2 Green Steven Alex Bradshaw 251 6.4 N/A Majority 231 Turnout 3,903 47.14 Liberal Democrats hold Swing 2.14
Hardwick Party Candidate Votes % ±% Liberal Democrats Michael Ian Atkins 1,865 43.2 +8.3 Conservative Lina Nieto 1,860 43.1 −3.8 Green Colin Reynolds 590 13.7 +7.1 Majority 5 Turnout 4,315 48.2 Liberal Democrats gain from Conservative Swing
Histon & Impington Party Candidate Votes % ±% Liberal Democrats Ros Hathorn 2,240 57.1 +3.2 Conservative Steven James Mastin 725 19.5 −3.7 Labour Khadija Arsalan 630 16.1 −0.6 Green Sandra Ann Archer 327 8.3 +2.1 Majority 1,515 Turnout 3,922 45.95 Liberal Democrats hold Swing
Linton Party Candidate Votes % ±% Liberal Democrats Henry Alexander Frederick Batchelor * 2,024 49.5 +1.9 Conservative John Joseph Bald 1,506 36.8 −1.6 Labour Philip David White 303 7.4 +0.5 Green Paul Evans 256 6.3 −0.8 Majority 518 Turnout 4,089 47.16 Liberal Democrats hold Swing 1.74
Longstanton, Northstowe & Over Party Candidate Votes % ±% Liberal Democrats Firouz Thompson 1,706 53.7 +13.9 Conservative Tom Bygott 1,126 35.5 −10.4 Green Maria Dawn Harrison 342 10.8 +5.9 Majority 580 Turnout 3,174 44.85 Liberal Democrats gain from Conservative Swing
Melbourn & Bassingbourn Party Candidate Votes % ±% Liberal Democrats Susan Elizabeth Kerr van de Ven * 1,854 55.5 −0.7 Conservative Tom Goldie 1,061 31.7 +6.0 Green Simon Peter Saggers 249 7.4 +1.6 Labour Christopher John Tudor Lewis 179 5.4 −0.3 Majority 793 Turnout 3,343 41.48 Liberal Democrats hold Swing
Papworth & Swavesey Party Candidate Votes % ±% Conservative Mandy Lorraine Smith * 1,309 45.7 −10.3 Labour Tom Mayer 864 28.4 +17.0 Liberal Democrats Peter David Sandford 568 18.6 −6.1 Green Daniel Aspel 217 7.2 −0.7 Majority 445 Turnout 3,039 40.99 Conservative hold Swing
One of the two Sawston & Shelford seats was vacant as Roger Hickford had resigned, the other incumbent did not stand for re-election.
Sawston & Shelford (2 Seats) Party Candidate Votes % ±% Liberal Democrats Brian Milnes 3,518 46.9 +8.3 Liberal Democrats Maria King 3,125 41.6 +1.4 Conservative Manas Deb 2,106 28.1 −14.8 Conservative Dale Keith Hargrove 2,045 27.2 −13.9 Green Sophi Berridge 1,041 13.9 N/A Labour Tracey Lynne Draper 898 12.0 −7.0 Green Eleanor Ruth Crane 743 9.9 N/A Labour Anand Pillai 679 9.0 −9.8 Majority 2,492 Turnout 7,504 47.57 Liberal Democrats gain from Conservative Swing Liberal Democrats gain from Conservative Swing
Waterbeach Party Candidate Votes % ±% Liberal Democrats Anna Elizabeth Bradnam * 1,462 36.0 −10.4 Labour James Phillip Bull 1,053 25.9 +9.8 Conservative Ben Shelton 1,050 25.8 −6.4 Green Thomas Anthony Lachlan-Cope 500 12.3 +7.0 Majority 409 Turnout 4.065 44.99 Liberal Democrats hold Swing
By-elections
St Neots The Eatons St Neots The Eatons: 16 February 2023 Party Candidate Votes % ±% Liberal Democrats Geoff Seeff 1,042 43.5 N/A Conservative Andrew Jennings 746 31.1 Independent Colin Maslen 360 15.0 Labour Taylor Purden 250 10.4 Majority 296 12.4 Turnout 2.398 25.5 −9.4 Liberal Democrats gain from St Neots Independents Swing
Arbury Arbury: 4 May 2023 Party Candidate Votes % ±% Labour Mike Black 1,174 43.0 –5.2 Conservative Robert Boorman 761 27.9 +11.1 Green Stephen Lawrence 397 14.6 +1.2 Liberal Democrats Sam Oliver 396 14.5 –7.2 Majority 413 15.1 Turnout 2,728 Labour hold Swing
Soham South and Haddenham Soham South and Haddenham: 4 May 2023 Party Candidate Votes % ±% Conservative Bill Hunt 1,568 44.6 −6.9 Liberal Democrats Connor Docwra 1,276 36.3 +12.8 Labour Simon Patenall 379 10.8 −6.8 Green Pip Gardner 293 8.3 +0.8 Majority 292 8.3 −19.6 Turnout 3,567 39.3 +3.9 Conservative hold Swing -9.9
Yaxley and Farcet Yaxley and Farcet: 21 March 2024 Party Candidate Votes % ±% Liberal Democrats Andrew Wood 509 31.0 +5.6 Conservative Kev Gulson 470 28.6 −28.3 Independent Sally Howell 448 27.3 New Labour Richard Ilett 175 10.6 −7.1 Green Ellisa Westerman 42 2.6 New Majority 39 2.4 N/A Turnout 1,648 20.0 −7.2 Liberal Democrats gain from Conservative Swing +16.9
See also
References ^ "Election Results". cambridgeshire.cmis.uk.com . Archived from the original on 6 July 2021. Retrieved 6 July 2021 . ^ "Election timetable" (PDF) . UK Government . Retrieved 27 May 2020 . ^ "Local Elections 2020". Peterborough City Council ^ "Elections in 2020". Cambridge City Council ^ "Police and Crime Commissioner elections". The Electoral Commission . Archived from the original on 11 September 2013. ^ "Deputy leader quits". www.holdthefrontpage.co.uk . Retrieved 17 May 2021 . ^ "County Councillors". Cambridgeshire County Council . Retrieved 19 September 2020 . ^ Josh Thomas (15 May 2018). "Cambridge News . Retrieved 4 May 2021 . ^ "Cambridge councillor Donald Adey resigns post 400 miles away". BBC News . 21 March 2019. Retrieved 4 May 2021 . ^ Ben Hatton (8 January 2020). "South Cambridgeshire District Council Conservative group leader Peter Topping steps down". Cambridge Independent . Retrieved 28 April 2021 . ^ "Councillor Sandra Crawford". cambridgeshire.cmis.uk.com . Archived from the original on 6 July 2021. Retrieved 6 July 2021 . ^ Benjamin Hatton (3 March 2021). "Former deputy leader Roger Hickford criticises council after resignation". Cambridge News . Retrieved 28 April 2021 . ^ No by-election was held as the resignation was sufficiently close to the upcoming County election. ^ "Whistleblower reveals council bullying". wwwelystandard.co.uk . Retrieved 17 May 2021 . ^ "Wisbech Standard". 30 April 2021. pp. 1–12. ^ a b c d e f "Results". www.cambridgeindependent.co.uk . 7 May 2021. Retrieved 17 May 2021 . ^ "England local elections". www.bbc.co.uk . Retrieved 13 May 2021 . ^ "Elections 2021". www.wisbechstandard.co.uk . ^ "Tories hint at coalition". www.cambridgeindependent.co.uk . 7 May 2021. Retrieved 15 May 2021 . ^ "Alliance". BBC News . 14 May 2021. Retrieved 14 May 2021 . ^ "Committee membership". www.cambridgeshire.gov.uk . Retrieved 15 June 2021 . ^ Hatton, Benjamin (20 May 2021). "Lib Dem Lucy Nethsingha officially selected as leader of Cambridgeshire County Council". Cambridgeshire Live . Retrieved 14 June 2021 . ^ a b "Election". elections.cmis.uk.com . ^ "Statement of Persons Nominated" (PDF) . Cambridge City Council (PDF) from the original on 9 April 2021. ^ "Elections May 2021". East Cambridgeshire District Council . Retrieved 13 April 2021 . ^ "Nine seats will be fought by 37 candidates". Fenland Citizen . 14 April 2021. p. 5. ^ a b c d e f g h "Cambridgeshire County Council". www.fenland.gov.uk . Retrieved 14 May 2021 .

 2.9%[1])


 Results Map
 2
2


 Council elections in Cambridgeshire


